When Your Network Assets Don’t Match Your Balance Sheet

Trusted by:


![]()
![]()

![]()
Telecom operators live in two parallel worlds. On one side: ducts, ODFs, routers, switches, GPON splitters, DWDM shelves. The physical and logical inventory that makes networks run. On the other: balance sheets, depreciation schedules, CapEx forecasts, and audit reports. The financial reality that makes the business run.
The problem? Those worlds barely talk to each other.
Inventory gets managed by operations. Depreciation gets handled by finance. CapEx forecasting sits somewhere in between, and nobody has the complete picture. The result is disjointed planning, inefficient investments, and hidden financial risk that shows up months or years too late.
Assets appear in the financial register but not in the inventory. Depreciation schedules outlive the actual equipment lifecycle. Spare parts get purchased “just in case” because planners don’t know what’s already in stock. CapEx flows to regions with underutilized equipment while other areas struggle with outdated infrastructure nearing collapse.
The issue isn’t lack of data. It’s that data lives in silos. Operations track ports, fibers, and logical overlays. Finance tracks purchase orders, invoices, and depreciation curves. Without integration, decisions get made on partial pictures, and the financial consequences pile up silently.
This disconnection costs operators real money. Dell’Oro Group reports that worldwide telecom CapEx declined 8% in 2024, with capital intensity ratios projected to drop from 16% in 2024 to 14% by 2027. In an environment where every dollar of CapEx needs to deliver measurable ROI, operators can’t afford the waste that comes from misaligned operational and financial data.
Depreciation: More Than Just an Accounting Exercise
Depreciation typically gets treated as a finance-only task. Apply a straight-line or accelerated model, depreciate assets over five to seven years, close the books. Done.
But what happens when that model doesn’t reflect reality?
Equipment that fails after three years still shows as an asset on the balance sheet for another four. A router that gets retired sits in a warehouse but continues depreciating on paper. Meanwhile, a GPON splitter running at 95% capacity in a growing market gets the same depreciation treatment as identical equipment sitting idle in a declining region.
The fix requires linking depreciation directly to asset performance, utilization, and lifecycle events. When inventory data connects to financial models, operators can:
Track actual lifespan against planned lifespan. Assets that fail early or outlive expectations get flagged so depreciation adjusts accordingly. No more ghost assets depreciating on balance sheets while sitting unused in storage.
Tie depreciation to service impact. A core router serving premium enterprise customers carries different financial risk than one handling low-density residential traffic. Weighting depreciation by business impact creates more accurate financial planning.
Support audit traceability. Every depreciation entry gets backed by live inventory records showing location, usage, and maintenance history. Auditors see not just numbers but the network reality behind them.
User Suggestion: Start by reconciling your financial asset register against live network inventory. Most operators discover 10-15% of their depreciated assets no longer exist in the network, while active equipment isn’t showing up in financial records at all. Fixing this gap immediately improves both operational accuracy and financial reporting.
This transforms depreciation from a static compliance task into a dynamic financial planning tool that reflects what’s actually happening in the network.
CapEx Planning That Reflects Network Reality
Operators face constant pressure to balance CapEx spending. Invest enough to maintain quality and support growth, but not so much that margins erode. The challenge is knowing where money will actually deliver the biggest impact.
Traditional CapEx planning relies on forecasts, historical patterns, and educated guesses. Better CapEx planning uses live inventory intelligence combined with financial forecasting to make data-driven decisions.
Grid Introduction: Connecting inventory to financial planning changes how operators approach CapEx allocation. Here’s how unified operational and financial data creates better investment decisions across different planning scenarios:
| Planning Scenario | Traditional Approach | Integrated Inventory + Finance | Financial Impact |
|---|---|---|---|
| Equipment Refresh | Replace based on age | Replace based on utilization + condition | Avoid premature replacement costs |
| CapEx Allocation | Distribute by region | Target capacity bottlenecks with demand data | Higher ROI per dollar spent |
| Depreciation Planning | Fixed schedule | Adjust for actual asset performance | More accurate financial forecasting |
| Spare Parts Inventory | Order based on estimates | Track actual stock + usage patterns | Reduce inventory carrying costs |
| End-of-Life Management | React to failures | Predict based on performance trends | Prevent service disruptions |
When inventory and financial data work together, several capabilities become possible:
- Refresh cycle planning. Automatically forecast when routers, switches, or optical equipment will reach end-of-life and align replacement budgets with actual network need rather than arbitrary timelines.
- Depreciation-aware CapEx allocation. Prioritize spending on assets nearing full depreciation to avoid financial write-offs while extending the useful life of infrastructure that still delivers value.
- Capacity-driven investments. GIS-based utilization metrics highlight which fiber routes or access nodes are approaching saturation, ensuring CapEx flows to areas with clear demand and ROI potential.
- Scenario simulation. Test different models: what happens to depreciation and CapEx forecasts if GPON rollout accelerates? Or if DWDM refresh cycles get delayed by a year? Running these scenarios with connected data produces accurate financial projections instead of guesswork.
Analysys Mason forecasts that capital intensity in telecom will fall from around 20% to 12-14% by the end of the decade. In this tightening environment, CapEx planning can’t be finance-driven alone. It needs to be service-driven, customer-driven, and ROI-driven with operational data feeding directly into financial models.
How Unified Visibility Changes the Game
Making this connection requires three components working together:
- Reconciled inventory. Physical assets like fiber, ODFs, routers, and switches merge with logical overlays including VLANs, tunnels, and GPON splits into a single live model. This eliminates the discrepancies that plague most operators.
- Lifecycle and maintenance tracking. Assets get tagged with purchase dates, warranty periods, vendor agreements, and performance history. This data feeds both operational planning and financial forecasting.
- Financial integration. Depreciation models, CapEx forecasts, and asset registers link to inventory data, creating a complete chain of evidence from physical deployment to financial reports.
The outcome: every asset becomes both a technical item and a financial item simultaneously. Operations knows the financial implications of decisions. Finance understands the operational reality behind the numbers.
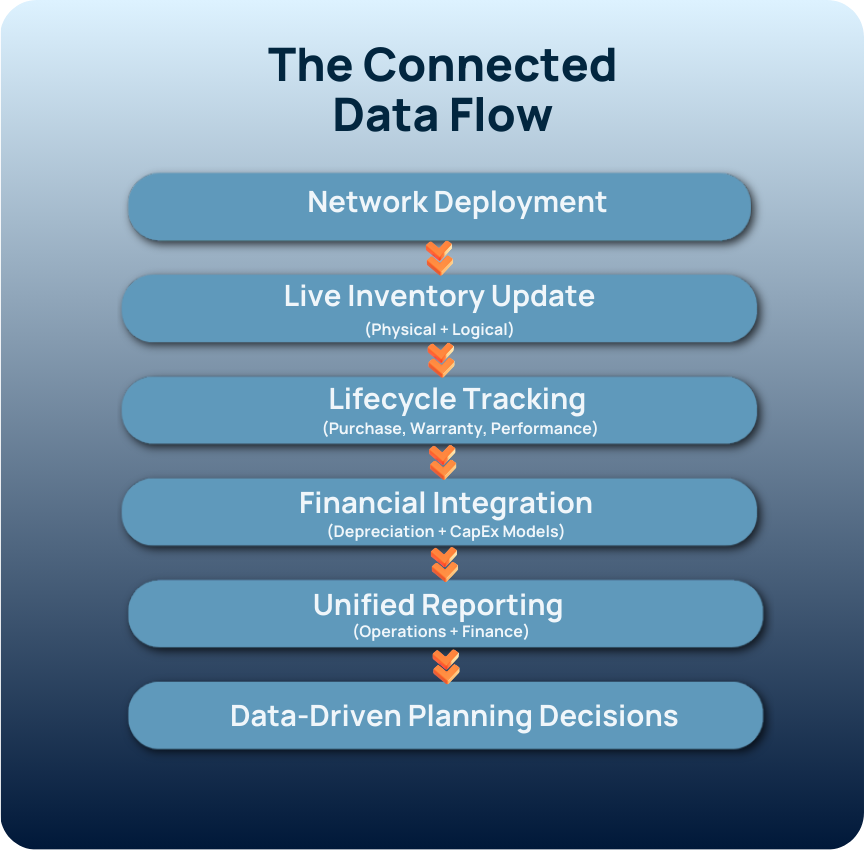
The Connected Data Flow
Here’s how operational and financial data flow together to create unified visibility. This shows the path from network deployment through financial reporting:
A practical example shows the impact. Telxius, managing over 94,000 km of submarine fiber across 93 PoPs in 23 countries, faced the challenge of maintaining unified visibility across physical, logical, and virtual layers. By implementing unified inventory that connected operational and financial data, they achieved end-to-end lineage from network interfaces through to billing records. This created traceability supporting both technical fault handling and financial audit trails, while streamlining alignment between deployed infrastructure and financial commitments.
Turning Data Silos Into Strategic Advantage
Most OSS platforms show operators what they have. The real value comes from showing what that inventory means financially.
Inventory accuracy ensures operators know exactly what’s deployed and where. Lifecycle visibility shows when equipment needs replacing before failures occur. Financial integration reveals what assets cost, how they depreciate, and which investments deliver the strongest returns.
Telecom operators already collect the data they need. The challenge is that it lives in silos with operations in one system and finance in another. Platforms that break down these walls transform assets from line items into strategic planning tools.
In an industry where CapEx efficiency directly impacts competitiveness, the operators who can connect network reality to financial planning will make smarter investments, reduce waste, and deliver better returns. Because building networks isn’t enough anymore. Building ones that make financial sense matters just as much.
Platforms like VC4’s Service2Create (S2C) support this shift by combining live inventory, lifecycle tracking, and financial integration into a unified system. It’s designed specifically to bridge the operational and financial divide, giving teams across the organization access to the same connected data. The result: better planning, clearer visibility, and CapEx decisions grounded in network reality rather than guesswork.
References
- Dell’Oro Group – “Worldwide Telecom Capex Decline Report” (April 2025)
https://www.delloro.com/news/worldwide-telecom-capex-to-decline-at-a-2-percent-cagr/ - Analysys Mason – “Network Capex Has Started a Long Decline” (May 2024)
https://www.analysysmason.com/research/content/articles/network-capex-decline-rdns0/